


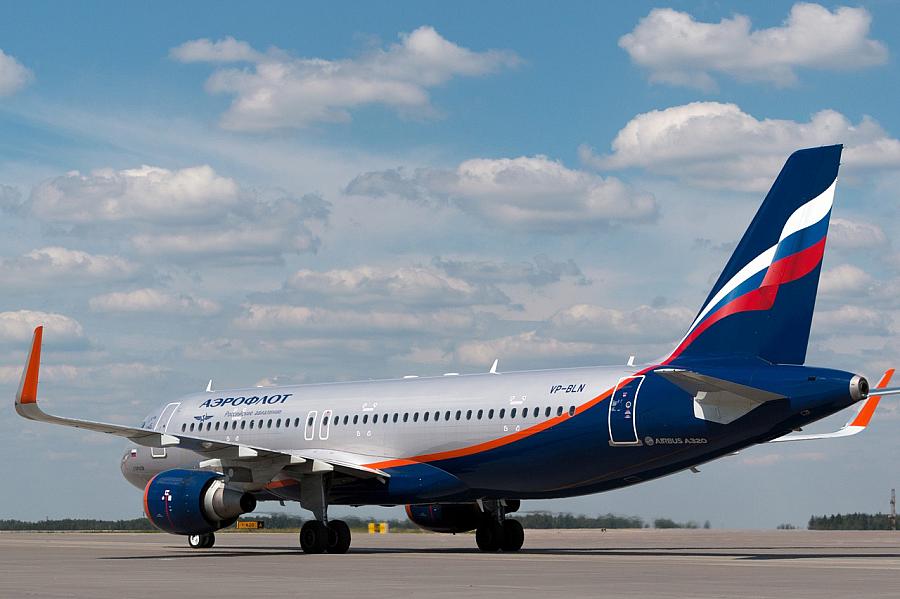
Aeroflot PJSC (Moscow Exchange ticker: AFLT) today announces Aeroflot Group operating results for July and 7M 2021[1].
Key highlights of July 2021[2]:
- Aeroflot Group carried 5.2 million passengers, 83.3% up year-on-year and 16.3% down vs. 2019;
- 4.4 million passengers carried in domestic segment, 54.2% up year-on-year and 26.3% up vs. 2019;
- Group’s RPK increased by 97.1% year-on-year and decreased by 28.1% vs. 2019, ASK increased by 87.3% year-on-year and decreased by 22.3% vs. 2019;
- Aeroflot Group’s passenger load factor was 83.4%, a 4.2 percentage point increase year-on-year;
- Aeroflot Group carried 23.7 thousand tonnes of cargo and mail, 36.9% up year-on-year;
- Pobeda Airlines carried 1.5 million passengers; passenger load factor was 95.3%.
July 2021 Operating Highlights compared to July 2020 and 2019
Aeroflot Group airlines: All flights
|
Aeroflot |
Pobeda |
Rossiya |
Total |
|
|
Passengers carried, thousand PAX |
2,482.5 |
1,496.7 |
1,242.8 |
5,222.0 |
|
Change vs. 2020, % |
2.4х |
44.1% |
60.2% |
83.3% |
|
Change vs. 2019, % |
(32.7%) |
46.4% |
(18.5%) |
(16.3%) |
|
Available Seat Kilometres, million |
7,663.2 |
2,619.4 |
3,593.8 |
13,876.4 |
|
Change vs. 2020, % |
2.6х |
40.5% |
37.0% |
87.3% |
|
Change vs. 2019, % |
(32.7%) |
35.8% |
(20.8%) |
(22.3%) |
|
Passenger load factor, % |
77.4% |
95.3% |
87.7% |
83.4% |
|
Change vs. 2020, % |
7.0 p.p. |
1.0 p.p. |
9.2 p.p. |
4.2 p.p. |
|
Change vs. 2019, % |
(10.2 p.p.) |
(1.5 p.p.) |
(6.2 p.p.) |
(6.7 p.p.) |
|
Cargo and mail carried, tonnes |
13,088.4 |
7,325.2 |
3,287.5 |
23,701.1 |
|
Change vs. 2020, % |
35.2% |
60.0% |
7.8% |
36.9% |
|
Change vs. 2019, % |
(29.7%) |
23.0% |
1.2% |
(14.8%) |
|
|
|
|
|
|
Aeroflot Group airlines: Domestic flights
|
Aeroflot |
Pobeda |
Rossiya |
Total |
|
|
Passengers carried, thousand PAX |
1,866.2 |
1,453.4 |
1,031.6 |
4,351.2 |
|
Change vs. 2020, % |
85.0% |
39.9% |
33.2% |
54.2% |
|
Change vs. 2019, % |
6.0% |
77.9% |
19.2% |
26.3% |
|
Available Seat Kilometres, million |
4,761.9 |
2,477.6 |
2,846.2 |
10,085.6 |
|
Change vs. 2020, % |
76.6% |
32.8% |
8.8% |
40.5% |
|
Change vs. 2019, % |
34.6% |
74.6% |
13.2% |
35.0% |
|
Passenger load factor, % |
83.4% |
96.3% |
88.5% |
88.0% |
|
Change vs. 2020, % |
10.9 p.p. |
1.9 p.p. |
10.1 p.p. |
7.7 p.p. |
|
Change vs. 2019, % |
(8.5 p.p.) |
(1.3 p.p.) |
(5.3 p.p.) |
(5.6 p.p.) |
|
Cargo and mail carried, tonnes |
6,907.5 |
6,858.3 |
3,253.6 |
17,019.4 |
|
Change vs. 2020, % |
8.3% |
49.8% |
8.3% |
22.0% |
|
Change vs. 2019, % |
20.2% |
75.9% |
7.2% |
34.2% |
|
|
|
|
|
|
Fleet update
In July 2021 Aeroflot Airlines added one Airbus A321NX. Aeroflot Airlines transferred one Boeing 737-800 to the fleet of Pobeda Airlines, two Airbus A320 and five SSJ100 to the fleet of Rossiya Airlines as part of intra-group redistribution. As of 31 July 2021, the fleet of Aeroflot Group consisted of 345 aircraft.
|
|
Net changes in the fleet |
Number of aircraft |
|
|
|
July 2021 |
7M 2021 |
as of 31.07.2021 |
|
Aeroflot Group |
+1 |
+3 |
345 |
|
Aeroflot Airlines |
–7 |
–39 |
202 |
|
Pobeda Airlines |
+1 |
+10 |
44 |
|
Rossiya Airlines |
+7 |
+32 |
99 |
Aeroflot Group Operating Results
(pro forma, excluding the results of Aurora Airlines in 2020)[3]
|
July 2021 |
July 2020 |
Change |
7M 2021 |
7M 2020 |
Change |
|
|
Passengers carried, thousand PAX |
5,222.0 |
2,849.4 |
83.3% |
23,779.0 |
15,417.0 |
54.2% |
|
- international |
870.8 |
27.2 |
32.0х |
3,323.8 |
4,523.1 |
(26.5%) |
|
- domestic |
4,351.2 |
2,822.2 |
54.2% |
20,455.2 |
10,894.0 |
87.8% |
|
Revenue Passenger Kilometres, mn |
11,579.4 |
5,874.1 |
97.1% |
50,569.7 |
38,100.7 |
32.7% |
|
- international |
2,706.0 |
109.1 |
24.8х |
11,048.0 |
16,845.4 |
(34.4%) |
|
- domestic |
8,873.4 |
5,765.0 |
53.9% |
39,521.7 |
21,255.3 |
85.9% |
|
Available Seat Kilometres, mn |
13,876.4 |
7,408.3 |
87.3% |
63,328.1 |
54,267.7 |
16.7% |
|
- international |
3,790.8 |
231.4 |
16.4х |
15,449.8 |
23,892.1 |
(35.3%) |
|
- domestic |
10,085.6 |
7,176.9 |
40.5% |
47,878.3 |
30,375.7 |
57.6% |
|
Passenger load factor, % |
83.4% |
79.3% |
4.2 p.p. |
79.9% |
70.2% |
9.6 p.p. |
|
- international |
71.4% |
47.2% |
24.2 p.p. |
71.5% |
70.5% |
1.0 p.p. |
|
- domestic |
88.0% |
80.3% |
7.7 p.p. |
82.5% |
70.0% |
12.6 p.p. |
|
Cargo and mail carried, tonnes |
23,701.1 |
17,309.2 |
36.9% |
150,349.5 |
120,749.4 |
24.5% |
|
- international |
6,681.7 |
3,353.6 |
99.2% |
51,161.2 |
53,088.3 |
(3.6%) |
|
- domestic |
17,019.4 |
13,955.6 |
22.0% |
99,188.3 |
67,661.2 |
46.6% |
|
Revenue Cargo Tonne Kilometres, mn |
89.9 |
70.6 |
27.4% |
631.0 |
556.7 |
13.3% |
|
- international |
32.6 |
19.1 |
70.7% |
281.2 |
293.0 |
(4.0%) |
|
- domestic |
57.3 |
51.4 |
11.3% |
349.8 |
263.7 |
32.6% |
|
Revenue Tonne Kilometres, mn |
1,132.1 |
599.2 |
88.9% |
5,182.3 |
3,985.8 |
30.0% |
|
- international |
276.2 |
28.9 |
9.5х |
1,275.5 |
1,809.1 |
(29.5%) |
|
- domestic |
855.9 |
570.3 |
50.1% |
3,906.7 |
2,176.7 |
79.5% |
|
Available Tonne Kilometres, mn |
1,666.9 |
931.5 |
79.0% |
8,013.0 |
6,901.8 |
16.1% |
|
- international |
471.4 |
86.3 |
5.5х |
2,378.9 |
3,321.8 |
(28.4%) |
|
- domestic |
1,195.5 |
845.1 |
41.5% |
5,634.1 |
3,580.0 |
57.4% |
|
Revenue load factor, % |
67.9% |
64.3% |
3.6 p.p. |
64.7% |
57.7% |
6.9 p.p. |
|
- international |
58.6% |
33.5% |
25.1 p.p. |
53.6% |
54.5% |
(0.8 p.p.) |
|
- domestic |
71.6% |
67.5% |
4.1 p.p. |
69.3% |
60.8% |
8.5 p.p. |
|
Revenue flights |
35,159 |
19,742 |
78.1% |
172,401 |
132,573 |
30.0% |
|
- international |
5,479 |
390 |
14.0х |
21,890 |
37,342 |
(41.4%) |
|
- domestic |
29,680 |
19,352 |
53.4% |
150,511 |
95,231 |
58.0% |
|
Flight hours |
88,791 |
47,644 |
86.4% |
428,658 |
358,503 |
19.6% |
Aeroflot Group Operating Results
Aeroflot Airlines
|
July 2021 |
July 2020 |
Change |
7M 2021 |
7M 2020 |
Change |
|
|
Passengers carried, thousand PAX |
2,482.5 |
1,034.7 |
2.4х |
10,847.3 |
8,842.1 |
22.7% |
|
- international |
616.3 |
26.2 |
23.5х |
2,516.4 |
3,505.2 |
(28.2%) |
|
- domestic |
1,866.2 |
1,008.6 |
85.0% |
8,330.9 |
5,336.9 |
56.1% |
|
Revenue Passenger Kilometres, mn |
5,930.7 |
2,055.3 |
2.9х |
25,721.6 |
23,189.0 |
10.9% |
|
- international |
1,961.3 |
101.6 |
19.3х |
8,702.5 |
12,961.9 |
(32.9%) |
|
- domestic |
3,969.4 |
1,953.7 |
2.0х |
17,019.1 |
10,227.2 |
66.4% |
|
Available Seat Kilometres, mn |
7,663.2 |
2,919.8 |
2.6х |
34,889.4 |
35,902.2 |
(2.8%) |
|
- international |
2,901.3 |
223.8 |
13.0х |
12,679.8 |
19,385.4 |
(34.6%) |
|
- domestic |
4,761.9 |
2,696.0 |
76.6% |
22,209.6 |
16,516.8 |
34.5% |
|
Passenger load factor, % |
77.4% |
70.4% |
7.0 p.p. |
73.7% |
64.6% |
9.1 p.p. |
|
- international |
67.6% |
45.4% |
22.2 p.p. |
68.6% |
66.9% |
1.8 p.p. |
|
- domestic |
83.4% |
72.5% |
10.9 p.p. |
76.6% |
61.9% |
14.7 p.p. |
|
Revenue flights |
17,588 |
9,396 |
87.2% |
84,868 |
89,471 |
(5.1%) |
|
- international |
4,137 |
380 |
10.9х |
16,910 |
31,234 |
(45.9%) |
|
- domestic |
13,451 |
9,016 |
49.2% |
67,958 |
58,237 |
16.7% |
|
Flight hours |
47,914 |
21,524 |
2.2х |
226,723 |
245,220 |
(7.5%) |
Pobeda Airlines
|
July 2021 |
July 2020 |
Change |
7M 2021 |
7M 2020 |
Change |
|
|
Passengers carried, thousand PAX |
1,496.7 |
1,038.9 |
44.1% |
7,894.4 |
3,972.7 |
98.7% |
|
- international |
43.3 |
- |
- |
266.1 |
447.4 |
(40.5%) |
|
- domestic |
1,453.4 |
1,038.9 |
39.9% |
7,628.3 |
3,525.2 |
2.2х |
|
Revenue Passenger Kilometres, mn |
2,496.8 |
1,759.7 |
41.9% |
12,984.9 |
6,943.8 |
87.0% |
|
- international |
111.1 |
- |
- |
660.6 |
998.2 |
(33.8%) |
|
- domestic |
2,385.7 |
1,759.7 |
35.6% |
12,324.3 |
5,945.5 |
2.1х |
|
Available Seat Kilometres, mn |
2,619.4 |
1,864.9 |
40.5% |
13,887.2 |
7,616.9 |
82.3% |
|
- international |
141.8 |
- |
- |
803.3 |
1,141.0 |
(29.6%) |
|
- domestic |
2,477.6 |
1,864.9 |
32.8% |
13,083.9 |
6,476.0 |
2.0х |
|
Passenger load factor, % |
95.3% |
94.4% |
1.0 p.p. |
93.5% |
91.2% |
2.3 p.p. |
|
- international |
78.3% |
- |
- |
82.2% |
87.5% |
(5.3 p.p.) |
|
- domestic |
96.3% |
94.4% |
1.9 p.p. |
94.2% |
91.8% |
2.4 p.p. |
|
Revenue flights |
8,304 |
5,797 |
43.2% |
44,716 |
23,047 |
94.0% |
|
- international |
290 |
- |
- |
1,714 |
2,720 |
(37.0%) |
|
- domestic |
8,014 |
5,797 |
38.2% |
43,002 |
20,327 |
2.1х |
|
Flight hours |
18,334 |
12,888 |
42.3% |
98,810 |
53,780 |
83.7% |
Rossiya Airlines
|
July 2021 |
July 2020 |
Change |
7M 2021 |
7M 2020 |
Change |
|
|
Passengers carried, thousand PAX |
1,242.8 |
775.7 |
60.2% |
5,037.3 |
2,602.3 |
93.6% |
|
- international |
211.2 |
1.0 |
210.1х |
541.3 |
570.4 |
(5.1%) |
|
- domestic |
1,031.6 |
774.7 |
33.2% |
4,496.0 |
2,031.8 |
2.2х |
|
Revenue Passenger Kilometres, mn |
3,151.9 |
2,059.2 |
53.1% |
11,863.2 |
7,967.9 |
48.9% |
|
- international |
633.6 |
7.5 |
84.1х |
1,684.9 |
2,885.3 |
(41.6%) |
|
- domestic |
2,518.4 |
2,051.6 |
22.7% |
10,178.3 |
5,082.6 |
2.0х |
|
Available Seat Kilometres, mn |
3,593.8 |
2,623.5 |
37.0% |
14,551.5 |
10,748.5 |
35.4% |
|
- international |
747.6 |
7.5 |
99.2х |
1,966.7 |
3,365.7 |
(41.6%) |
|
- domestic |
2,846.2 |
2,615.9 |
8.8% |
12,584.8 |
7,382.9 |
70.5% |
|
Passenger load factor, % |
87.7% |
78.5% |
9.2 p.p. |
81.5% |
74.1% |
7.4 p.p. |
|
- international |
84.7% |
100.0% |
(15.3 p.p.) |
85.7% |
85.7% |
(0.1 p.p.) |
|
- domestic |
88.5% |
78.4% |
10.1 p.p. |
80.9% |
68.8% |
12.0 p.p. |
|
Revenue flights |
9,267 |
4,549 |
2.0х |
42,817 |
20,055 |
2.1х |
|
- international |
1,052 |
10 |
105.2х |
3,266 |
3,388 |
(3.6%) |
|
- domestic |
8,215 |
4,539 |
81.0% |
39,551 |
16,667 |
2.4х |
|
Flight hours |
22,543 |
13,233 |
70.4% |
103,125 |
59,503 |
73.3% |
Aeroflot Group Operating Results (including the results of Aurora Airlines in 2020)[4]
|
July 2021 |
July 2020 |
Change |
7M 2021 |
7M 2020 |
Change |
|
|
Passengers carried, thousand PAX |
5,222.0 |
2,919.9 |
78.8% |
23,779.0 |
15,847.0 |
50.1% |
|
- international |
870.8 |
27.7 |
31.4х |
3,323.8 |
4,594.3 |
(27.7%) |
|
- domestic |
4,351.2 |
2,892.2 |
50.4% |
20,455.2 |
11,252.7 |
81.8% |
|
Revenue Passenger Kilometres, mn |
11,579.4 |
5,970.4 |
93.9% |
50,569.7 |
38,688.9 |
30.7% |
|
- international |
2,706.0 |
109.8 |
24.6х |
11,048.0 |
16,954.4 |
(34.8%) |
|
- domestic |
8,873.4 |
5,860.6 |
51.4% |
39,521.7 |
21,734.6 |
81.8% |
|
Available Seat Kilometres, mn |
13,876.4 |
7,586.0 |
82.9% |
63,328.1 |
55,456.8 |
14.2% |
|
- international |
3,790.8 |
233.6 |
16.2х |
15,449.8 |
24,104.8 |
(35.9%) |
|
- domestic |
10,085.6 |
7,352.4 |
37.2% |
47,878.3 |
31,352.0 |
52.7% |
|
Passenger load factor, % |
83.4% |
78.7% |
4.7 p.p. |
79.9% |
69.8% |
10.1 p.p. |
|
- international |
71.4% |
47.0% |
24.4 p.p. |
71.5% |
70.3% |
1.2 p.p. |
|
- domestic |
88.0% |
79.7% |
8.3 p.p. |
82.5% |
69.3% |
13.2 p.p. |
|
Cargo and mail carried, tonnes |
23,701.1 |
17,760.7 |
33.4% |
150,349.5 |
123,751.0 |
21.5% |
|
- international |
6,681.7 |
3,354.6 |
99.2% |
51,161.2 |
53,210.0 |
(3.9%) |
|
- domestic |
17,019.4 |
14,406.1 |
18.1% |
99,188.3 |
70,541.0 |
40.6% |
|
Revenue Cargo Tonne Kilometres, mn |
89.9 |
71.4 |
26.0% |
631.0 |
561.7 |
12.3% |
|
- international |
32.6 |
19.1 |
70.7% |
281.2 |
293.2 |
(4.1%) |
|
- domestic |
57.3 |
52.2 |
9.6% |
349.8 |
268.5 |
30.3% |
|
Revenue Tonne Kilometres, mn |
1,132.1 |
608.7 |
86.0% |
5,182.3 |
4,043.7 |
28.2% |
|
- international |
276.2 |
29.0 |
9.5х |
1,275.5 |
1,819.1 |
(29.9%) |
|
- domestic |
855.9 |
579.7 |
47.6% |
3,906.7 |
2,224.6 |
75.6% |
|
Available Tonne Kilometres, mn |
1,666.9 |
949.9 |
75.5% |
8,013.0 |
7,025.6 |
14.1% |
|
- international |
471.4 |
86.6 |
5.4х |
2,378.9 |
3,345.0 |
(28.9%) |
|
- domestic |
1,195.5 |
863.4 |
38.5% |
5,634.1 |
3,680.6 |
53.1% |
|
Revenue load factor, % |
67.9% |
64.1% |
3.8 p.p. |
64.7% |
57.6% |
7.1 p.p. |
|
- international |
58.6% |
33.5% |
25.1 p.p. |
53.6% |
54.4% |
(0.8 p.p.) |
|
- domestic |
71.6% |
67.1% |
4.5 p.p. |
69.3% |
60.4% |
8.9 p.p. |
|
Revenue flights |
35,159 |
21,202 |
65.8% |
172,401 |
142,136 |
21.3% |
|
- international |
5,479 |
402 |
13.6х |
21,890 |
38,510 |
(43.2%) |
|
- domestic |
29,680 |
20,800 |
42.7% |
150,511 |
103,626 |
45.2% |
|
Flight hours |
88,791 |
50,235 |
76.8% |
428,658 |
375,452 |
14.2% |


